Bestand:Window function (comparsion).png
Naar navigatie springen
Naar zoeken springen
Grootte van deze voorvertoning: 800 × 588 pixels. Andere resoluties: 320 × 235 pixels | 640 × 470 pixels | 988 × 726 pixels.
Oorspronkelijk bestand (988 × 726 pixels, bestandsgrootte: 54 kB, MIME-type: image/png)
.png)
Beschrijving
| Beschrijving |
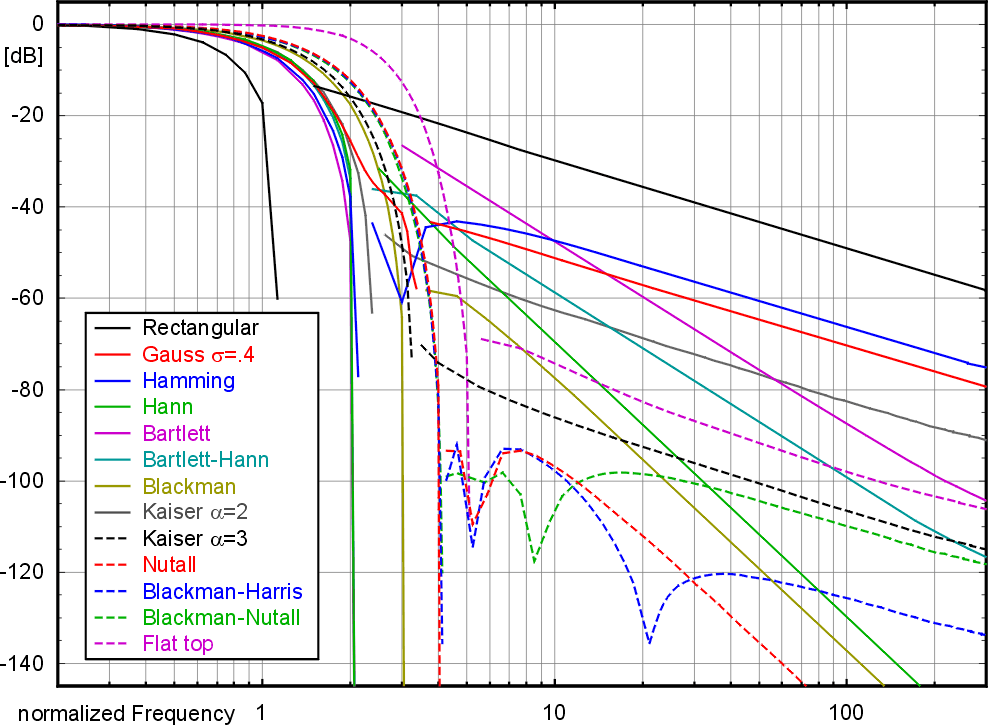
English: Comparison of different window functions |
||||||||
| Datum | |||||||||
| Bron | Own Work by user Marcel Müller | ||||||||
| Auteur | Marcel Müller | ||||||||
| Toestemming (Hergebruik van dit bestand) |
Marcel Müller uit en.wikipedia.org, de auteursrechthebbende van dit werk, maakt het hierbij onder de volgende licentie beschikbaar:
|

|
Deze grafiek zou opnieuw moeten worden aangemaakt als een SVG-bestand door vectorafbeeldingen te gebruiken. Dit heeft een aantal voordelen; zie Commons:Media for cleanup voor meer informatie. Als er een SVG-formaat van deze afbeelding bestaat, dan deze graag uploaden. Nadat u dit heeft gedaan, gelieve dit sjabloon te vervangen door het sjabloon {{vector version available|nieuwe bestandsnaam.svg}} op deze afbeeldingspagina.
|
Image details and source code
The image is created with Mathematica 3.0 and some beautifications with CorelDraw 7.0. Due to the old versions no SVG export is available.
Init
<< Graphics`Graphics`
<< Graphics`Legend`
Parameters
Len = 4096;   (* Window length *)
Oversamp = 8; (* Oversampling *)
Helper functions
CreateWindow[winfn_] := Table[winfn[p/Len], {p,0,Len}]

DoFFT[data_] := Chop@Take[
  Fourier[RotateLeft[Join[data, Table[0, {Oversamp*(Length[data]-1)-Length[data]}]], (Length[data]-1)/2]],
  (Length[data]-1)*Oversamp/2+1]

GetEnvelope[data_] := Block[
  {min = 1, max, last = data[[1]]},
  While[data[[min+1]] < last*1.001, last=data[[++min]]];
  Map[
    {#,data[[#]]}&,
    {Range[min], Select[Range[2, Length[data]-1], # > min && data[[#-1]] < data[[#]] > data[[#+1]]&]},
    {2}]
]

PlotWin[winfo_,opt___] := Block[
  {fft = Abs@DoFFT@CreateWindow@winfo[[2]]},
  ListPlot[
    20*Log[10, fft/fft[[1]]+1*^-12],
    GridLines->Automatic, PlotJoined->True, Frame->True, PlotRange->All, opt]
]

PlotWin2[winfo_,opt___] := Block[
  {fft = GetEnvelope@Abs@DoFFT@CreateWindow@winfo[[2]]},
  {LogLinearListPlot[
     {#[[1]]/Oversamp, 20*Log[10,#[[2]]/fft[[1,1,2]]+1*^-12]}& /@ fft[[1]],
     GridLines->Automatic, PlotJoined->True, Frame->True, PlotRange->All, opt],
   LogLinearListPlot[
     {#[[1]]/Oversamp, 20*Log[10,#[[2]]/fft[[1,1,2]]+1*^-12]}& /@ fft[[2]],
     GridLines->Automatic, PlotJoined->True, Frame->True, PlotRange->All, opt]}
]

Colors = Apply[
  RGBColor,
  {{0,0,0}, {1,0,0}, {0,0,1}, {0,.7,0}, {.8,0,.8}, {0,.6,.6}, {.6,.6,0}, {.5,.5,.5}},
  {1}];

Dashings = AbsoluteDashing/@(2{{} (*, {4,2}, {4,2,2,2}*)});

GetStyle[i_] :=
  {Colors[[Mod[i-1,Length[Colors]]+1]],
   Dashings[[Mod[Quotient[i-1,Length[Colors]], Length[Dashings]]+1]]}
Window Functions
GaussWin[sigma_] = Exp[-.5 * ((2#-1)/sigma)^2]&;

CosWin[a__] = Apply[Plus, {a} * Table[(-1)^p Cos[2 Pi p #], {p, 0, Length[{a}]-1}]]&;

KaiserWin[alpha_] = BesselI[0, Pi alpha Sqrt[1 - (2#-1)^2]] / BesselI[0, Pi alpha]&;

WinFN = {
  {"Recangular",        1&,                                          1.},
  {"Gauss \[Sigma]=.4", GaussWin[.4],                                1.45},
  {"Hamming",           CosWin[.53836,.46164],                       1.37},
  {"Hann",              CosWin[.5,.5],                               1.5},
  {"Bartlett",          1-Abs[2#-1]&,                                1.33},
  {"Bartlett-Hann",     .62-.48Abs[#-.5]-.38Cos[2Pi#]&,              1.46},
  {"Blackman",          CosWin[.42,.5,.08],                          1.73},
  {"Kaiser \[Alpha]=1", KaiserWin[1],                                1.2},
  {"Kaiser \[Alpha]=2", KaiserWin[2],                                1.5},
  {"Kaiser \[Alpha]=3", KaiserWin[3],                                1.8},
  {"Nutall",            CosWin[.355768,.487396,.144232,.012604],     2.01},
  {"Blackman-Harris",   CosWin[.35875,.48829,.14128,.01168],         2.01},
  {"Blackman-Nutall",   CosWin[.3635819,.4891775,.1365995,.0106411], 1.98},
  {"Flat top",          CosWin[1,1.93,1.29,.388,.032],               3.77}
};
Test Results
PlotWin[WinFN[[-1]]];

PlotWin2[WinFN[[-1]]];

ListPlot@CreateWindow[WinFN[[-1,2]]];

LogLogListPlot[DoFFT@CreateWindow[WinFN[[-1,2]]],
  PlotRange->All, PlotJoined->True, GridLines->Automatic];

DoFFT@CreateWindow[WinFN[[-1,2]]]

GetEnvelope[Abs@DoFFT[CreateWindow[WinFN[[1,2]]]]]
Results
gr = Show[MapIndexed[
  PlotWin2[#, DisplayFunction->Identity, PlotStyle->GetStyle[#2[[1]]]&, WinFN],
  DisplayFunction->$DisplayFunction, PlotRange->{All, {-145,5}}];

gr2 = ShowLegend[
  gr, {MapIndexed[{Graphics[Append[GetStyle[#2[[1]]], Line[{{0,0},{1,0}}]]],#[[1]]}&, WinFN],
  LegendShadow->{0,0}, LegendPosition->{-.8,-.5}, LegendSize->{.4,.55}, LegendTextSpace->5}];
Licentie
Marcel Müller uit en.wikipedia.org, de auteursrechthebbende van dit werk, maakt het hierbij onder de volgende licentie beschikbaar:
| Dit bestand is gelicenseerd onder de Creative Commons-licentie Naamsvermelding-Gelijk delen 3.0 Unported Onderhevig aan disclaimers. | ||
| Naamsvermelding: Marcel Müller uit en.wikipedia.org | ||
| ||
| Deze licentietag is toegevoegd aan dit bestand in verband met de GFDL licentie-update. |

|
Toestemming wordt verleend voor het kopiëren, verspreiden en/of wijzigen van dit document onder de voorwaarden van de GNU-licentie voor vrije documentatie, versie 1.2 of enige latere versie als gepubliceerd door de Free Software Foundation; zonder Invariant Sections, zonder Front-Cover Texts, en zonder Back-Cover Texts. Een kopie van de licentie is opgenomen in de sectie GNU-licentie voor vrije documentatie. Onderhevig aan disclaimers. |
Oorspronkelijk uploadlogboek
De oorspronkelijke beschrijving van deze afbeelding stond hier. Alle volgende gebruikersnamen verwijzen naar en.wikipedia.
- 2007-01-19 20:25 Marcel Müller 988×726×??? (82239 bytes) Frequency response of the window functions. The double logarithmic plot shows the magnitude in dB over the normalized frequency. Besides the main lobe only the envelope of the frequency response is shown. This is more clearly and allows a quick comparsion
Bestandsgeschiedenis
Klik op een datum/tijd om het bestand te zien zoals het destijds was.
| Datum/tijd | Miniatuur | Afmetingen | Gebruiker | Opmerking | |
|---|---|---|---|---|---|
| huidige versie | 2 okt 2016 22:53 | | 988 × 726 (54 kB) | wikimediacommons>Cmdrjameson | Compressed with pngout. Reduced by 26kB (33% decrease). |
Bestandsgebruik
Dit bestand wordt op de volgende pagina gebruikt:
.png)