Bestand:Solid state electronic band structure.svg

Beschrijving
| Beschrijving |
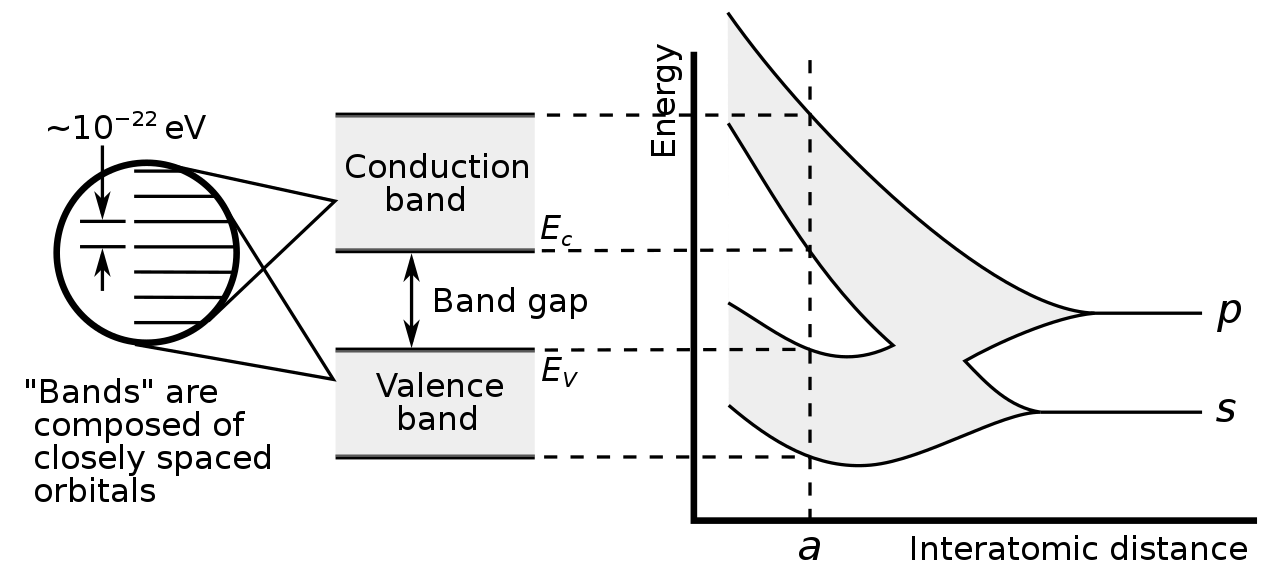
English: Diagram illustrating how electronic band structure of a solid comes about by the hypothetical example of a large number of carbon atoms coming together to form a diamond crystal lattice. The graph (right) shows the energy levels of the atoms as a function of the spacing between atoms. When the atoms are far apart (right side of graph) each atom has valence atomic orbitals p and s which have the same energy. However when the atoms come closer together their orbitals begin to overlap. The Pauli Exclusion Principle dictates that no two atoms in a molecule can have electrons with the same quantum numbers, so each atomic orbital splits into N molecular orbitals each with a different energy, where N is the number of atoms in the crystal. Since N is such a large number (~1022) adjacent orbitals are extremely close together in energy (~10-22 eV) so the orbitals can be considered a continuous energy band.
a is the atomic spacing (lattice constant) found in an actual crystal lattice of carbon atoms (diamond lattice) so the band structure at that spacing is the one found in diamond. At that spacing the orbitals form two bands, called the valence band and conduction band, with an energy gap of 5.5 electron volts (eV) between them. The valence electrons fill the lower band. Electrons in this band are not mobile; while electrons in the higher conduction band can travel through the crystal from atom to atom, and thus serve as charge carriers to conduct electricity. Since the 5.5 eV band gap is much larger than the thermal energy of most electrons in the crystal, very few electrons acquire the energy to jump the gap and become conduction electrons. This is why diamond is an electrical insulator. Русский: Формирование зон при сближении атомов |
| Datum | |
| Bron | Eigen werk |
| Auteur | Chetvorno |
| Andere versies |
|
| SVG ontwikkeling |


Licentie
| Dit bestand is beschikbaar onder Creative Commons CC0 1.0 Universele toewijding aan het publieke domein. | |
| De persoon die een werk voorziet van deze licentie stelt dit werk beschikbaar aan het publieke domein door, voor zover dit wettelijk is toegestaan, afstand te doen van alle rechten op het werk in de zin van het auteursrecht, met inbegrip van alle aanverwante of naburige rechten. U kunt het werk kopiëren, aanpassen, distribueren en uitvoeren, ook voor commerciële doeleinden, zonder dat u daarvoor toestemming hoeft te vragen.
|
Bestandsgeschiedenis
Klik op een datum/tijd om het bestand te zien zoals het destijds was.
| Datum/tijd | Miniatuur | Afmetingen | Gebruiker | Opmerking | |
|---|---|---|---|---|---|
| huidige versie | 9 mei 2017 03:58 | | 388 × 177 (29 kB) | wikimediacommons>Chetvorno | Replaced invalid Inkscape SVG version with "plain SVG" version which passes validation |
Bestandsgebruik
Dit bestand wordt op de volgende pagina gebruikt: