Bestand:Frequency distribution of climate sensitivity, based on model simulations (NASA).png
Naar navigatie springen
Naar zoeken springen
Geen hogere resolutie beschikbaar.
Frequency_distribution_of_climate_sensitivity,_based_on_model_simulations_(NASA).png (543 × 152 pixels, bestandsgrootte: 8 kB, MIME-type: image/png)
.png)
Beschrijving
| Beschrijving |
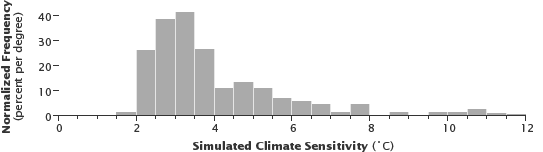
English: This image shows a frequency distribution of climate sensitivity, based on model simulations. Based on the cited Lindsey (2010) public-domain source: To understand how uncertainty about the underlying physics of the climate system affects climate predictions, scientists have a common test: they have the model predict what the average surface temperature would be if atmospheric carbon dioxide concentrations were to double pre-industrial levels (the climate sensitivity). They run the simulation thousands of times, each time changing the starting assumptions of one or more processes. When they put all the predictions from these thousands of simulations onto a single graph, what they get is a picture of the most likely outcomes and the least likely outcomes. The pattern that emerges from these types of tests is interesting. Few of the simulations result in less than 2 °C of warming—near the low end of estimates by the Intergovernmental Panel on Climate Change (IPCC). Some simulations result in significantly more than the 4 °C, which is at the high end of the IPCC estimates. This pattern (statisticians call it a “right-skewed distribution”) suggests that if carbon dioxide concentrations double, the probability of very large increases in temperature is greater than the probability of very small increases. Our ability to predict the future climate is far from certain, but this type of research suggests that the question of whether global warming will turn out to be less severe than scientists think may be less likely than whether it may be far worse. |
| Datum | |
| Bron | frequency_distribution1.png on: What if global warming isn’t as severe as predicted? : Climate Q&A : Blogs. Earth Observatory, part of the EOS Project Science Office, located at NASA Goddard Space Flight Center. |
| Auteur | Rebecca Lindsey |
| Toestemming (Hergebruik van dit bestand) |
Image Use Policy: "Most materials published on the Earth Observatory, including images, are freely available for re-publication or re-use, including commercial purposes, with the following exceptions: *where copyright is indicated, you must obtain the copyright holder’s permission; we usually provide links to the organization that holds the copyright, *images from the SeaWiFS sensor older than five years are in the public domain and can be re-used or re-published for any purpose. Images less than five years old can be re-used only for educational or scientific purposes; any commercial use of such images must be coordinated with GeoEye. We ask that NASA’s Earth Observatory be given credit for its original materials; the only mandatory credit is NASA." |
Licentie
| Dit bestand bevindt zich in het publiek domein, omdat het gemaakt is door de NASA. In de reproductierichtlijnen van de NASA staat dat "NASA-materiaal niet beschermd wordt door auteursrecht, tenzij anders vermeld". | ||
 |
Waarschuwingen:
|
Bestandsgeschiedenis
Klik op een datum/tijd om het bestand te zien zoals het destijds was.
| Datum/tijd | Miniatuur | Afmetingen | Gebruiker | Opmerking | |
|---|---|---|---|---|---|
| huidige versie | 28 jan 2020 16:52 | 543 × 152 (8 kB) | wikimediacommons>David Fuchs | remove empty white space |
Bestandsgebruik
Dit bestand wordt op de volgende pagina gebruikt:
.png)