Bestand:Butterworth filter bode plot.svg

Beschrijving
| Beschrijving |
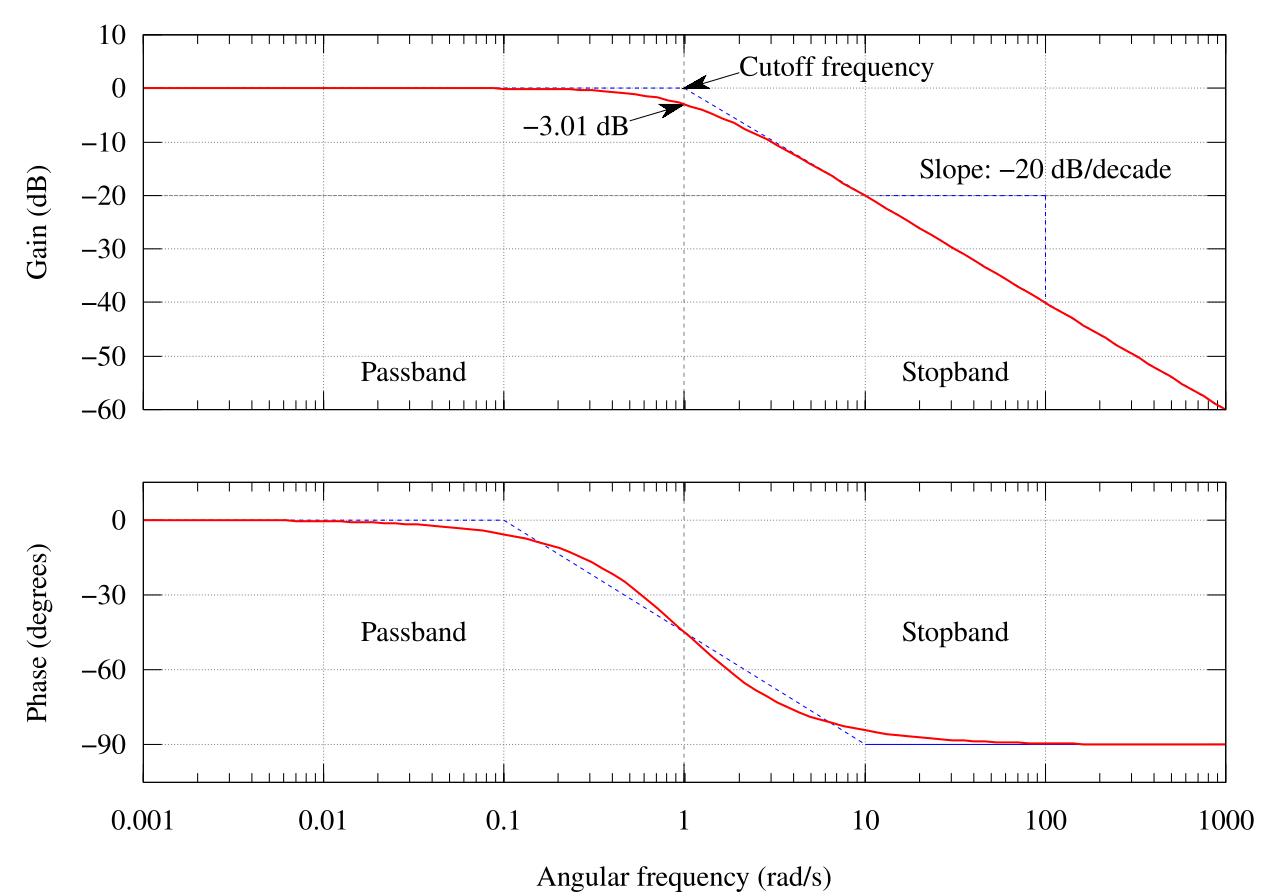
English: The Bode plot of a Butterworth filter with logarithmic axes and various labels. Cutoff frequency is normalized to 1 rad/s. Gain is normalized to 0 dB in the passband. Phase is in degrees because that's typical.
The code is kind of kludgy, but makes a good output. Generated in gnuplot with the script below (save as butterworth_bode_plot.plt and then open in gnuplot). Then it was postprocessed with Inkscape. See Wikipedia graph-making tips. Many orders on one plot: Image:Butterworth orders.png
Multilingual: Engels; Spaans; Russisch |
||
| Datum | 26 april 2006 (uploaddatum) | ||
| Bron | Eigen werk | ||
| Auteur | Alejo2083 | ||
| Andere versies |
[] .svg:
.png:
|
||
| gnuplot source | click to expand
set terminal svg enhanced size 1250 875 fname "Times" fsize 25
set output "Butterworth_filter_bode_plot.svg"

# Butterworth amplitude response and decibel calculation.  n is the order, which is just 1 in this image.
G(w,n) = 1 / (sqrt(1 + w**(2*n)))
dB(x) = 20 * log10(abs(x))
# Phase is for first order
P(w) = -atan(w)*180/pi


# Gridlines
set grid

# Set x axis to logarithmic scale
set logscale x 10

# No need for a key
set nokey #0.1,-25

# Frequency response's line plotting style
set style line 1 lt 1 lw 2

# Asymptote lines and slope lines are the same "arrow" style
set style line 3 lt 3 lw 1
set style arrow 3 nohead ls 3

# -3 dB arrow style
set style line 4 lt 4 lw 1
set style arrow 4 head filled size screen 0.02,15,45 ls 4

# Separator between passband and stopband line style
set style line 2 lt 2 lw 1
set style arrow 2 nohead ls 2


set multiplot

# Magnitude response
# =============================================
set size 1,0.5
set origin 0,0.5

# Set range of x and y axes
set xrange [0.001:1000]
set yrange [-60:10]

# Create x-axis tic marks once per decade (every multiple of 10)
set xtics 10
#set ytics 10

# No need for two sets of numbers
set format x ""

# Use 10 x-axis minor divisions per major division
set mxtics 10

# Axis labels
set ylabel "Gain (dB)"

# Draw asymptote lines
set arrow 1 from 1,0 to 1000,-60 as 3
set arrow 2 from .001,0 to 1,0 as 3

# -3 dB arrow
set arrow 4 from 2,3 to 1,0 as 4

# "Cutoff frequency" label uses same coordinates as the function
set label 3 "Cutoff frequency" at 2,4 l

# "-3 dB" label
set arrow 5 from 0.5,-6 to 1,-3 as 4
set label 4 "-3.01 dB" at 0.5,-7 r

# Draw a separator between passband and stopband and label them
set arrow 3 from 1,-60 to 1,10 as 2

# Label coordinates are relative to the graph window, not to the function, centered at the 1/4 and 3/4 width points
set label 1 "Passband" at graph 0.25, graph 0.1 c
set label 2 "Stopband" at graph 0.75, graph 0.1 c

# Draw slope lines and label
set arrow 6 from 100,-20 to 12,-20 as 3
set arrow 7 from 100,-20 to 100,-39 as 3
set label 5 "Slope: -20 dB/decade" at 100,-15 c

plot dB(G(x,1)) ls 1  title "1st-order response"


#Phase response
# =============================================
set size 1,0.5
set origin 0,0

# Set range of x and y axes
set yrange [-105:15]

# Create y-axis tic marks every 15 degrees
set ytics 30

# Regular numbers
set format x "% g"

# Axis labels
set ylabel "Phase (degrees)"
set xlabel "Angular frequency (rad/s)"

# Draw asymptote lines
set arrow 1 from 0.1,0 to 10,-90 as 3
set arrow 2 from 0.001,0 to 0.1,0 as 3
set arrow 10 from 10,-90 to 1000,-90 as 3

# -3 dB arrow
unset arrow 4 #from 2,3 to 1,0 as 4

# "Cutoff frequency" label uses same coordinates as the function
unset label 3 #"Cutoff frequency" at 2,4 l

# "-3 dB" label
unset arrow 5 #from 0.5,-6 to 1,-3 as 4
unset label 4 #"-3.01 dB" at 0.5,-7 r

# Draw a separator between passband and stopband and label them
set arrow 3 from 1,-105 to 1,15 as 2

# Label coordinates are relative to the graph window, not to the function, centered at the 1/4 and 3/4 width points
set label 1 "Passband" at graph 0.25, graph 0.5 c
set label 2 "Stopband" at graph 0.75, graph 0.5 c

# Draw slope lines and label
unset arrow 6 #from 100,-20 to 12,-20 as 3
unset arrow 7 #from 100,-20 to 100,-39 as 3
unset label 5 #"Slope: -20 dB/decade" at 100,-18 c

plot P(x) ls 1 title "Phase response"


unset multiplot
|


|
Er is een rasterversie van deze afbeelding beschikbaar. Als die beter is, zou die gebruikt moeten worden in plaats van deze vectorversie. File:Butterworth filter bode plot.svg → File:Butterworth filter bode plot.png
Voor meer informatie over raster- (ook wel bekend als bitmap-) en vectorafbeeldingen, zie Commons overgang naar SVG of Informatie over Wikimedia's ondersteuning van SVG-afbeeldingen. |
 |
Licentie

|
Toestemming wordt verleend voor het kopiëren, verspreiden en/of wijzigen van dit document onder de voorwaarden van de GNU-licentie voor vrije documentatie, versie 1.2 of enige latere versie als gepubliceerd door de Free Software Foundation; zonder Invariant Sections, zonder Front-Cover Texts, en zonder Back-Cover Texts. Een kopie van de licentie is opgenomen in de sectie GNU-licentie voor vrije documentatie. |
| Dit bestand is gelicenseerd onder de Creative Commons-licentie Naamsvermelding-Gelijk delen 3.0 Unported | ||
| ||
| Deze licentietag is toegevoegd aan dit bestand in verband met de GFDL licentie-update. |
- De gebruiker mag:
- Delen – het werk kopiëren, verspreiden en doorgeven
- Remixen – afgeleide werken maken
- Onder de volgende voorwaarden:
- naamsvermelding – U moet op een gepaste manier aan naamsvermelding doen, een link naar de licentie geven, en aangeven of er wijzigingen in het werk zijn aangebracht. U mag dit op elke redelijke manier doen, maar niet zodanig dat de indruk wordt gewekt dat de licentiegever instemt met uw werk of uw gebruik van zijn werk.
- Gelijk delen – Als u het materiaal remixt, transformeert of erop voortbouwt, moet u uw bijdragen verspreiden onder dezelfde licentie als die van het origineel, of een licentie die daarmee verenigbaar is.
Bestandsgeschiedenis
Klik op een datum/tijd om het bestand te zien zoals het destijds was.
| Datum/tijd | Miniatuur | Afmetingen | Gebruiker | Opmerking | |
|---|---|---|---|---|---|
| huidige versie | 12 okt 2023 03:39 | | 1.250 × 875 (31 kB) | wikimediacommons>Mikhail Ryazanov | +ru translation |
Bestandsgebruik
Dit bestand wordt op de volgende pagina gebruikt: